Gallery
Histogram of alignment scores
Assuming a single library loaded in a data frame called clonotypes with the read clonotypes() function:
hist(log(clonotypes$score)
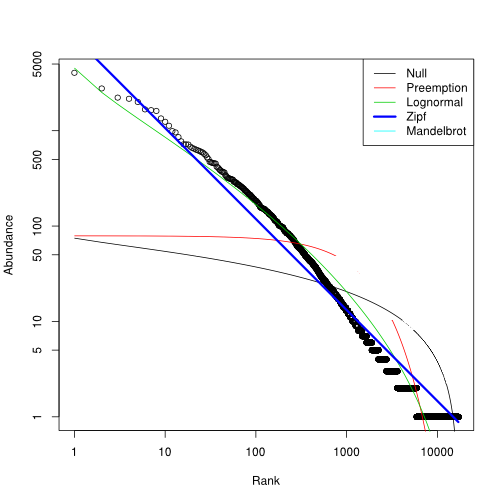
Scale-free distribution of the clonotype expression levels
Assuming table a of clonotype counts produced with the clonotype table() function, the following
commands study the first library in that table.
library(vegan)
plot(radfit(a?1), log="xy")
Grouping libraries by bootstraped hierarchical clustering
Assuming table a of clonotype counts produced with the clonotype table() function, containing six libraries (for instance two biological triplicates).
library(pvclust)
plot(pvclust(a, n=1000))
Differential expression analysis
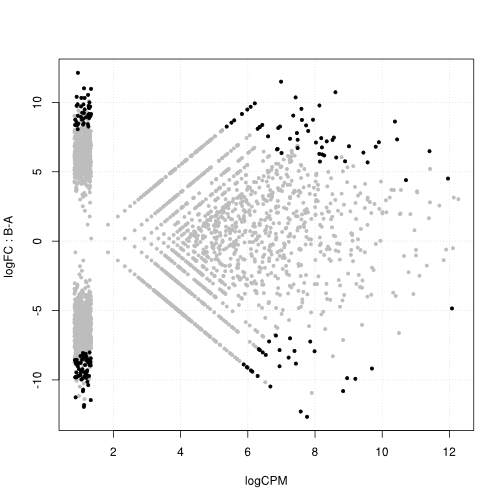
Assuming table a of clonotype counts produced with the clonotype table() function, containing six libraries (for instance two biological triplicates).
This representation is similar to MA plots used in microarray and digital expression analysis, where the x axis represents the average expression strength, and the y axis represents the fold change (both on a logarithmic scale). Black dots represent clonotypes over-represented in one population compared to the other.
library(edgeR)
a.dge <- DGEList(counts=a,group=c("B","A","A","B","A","B"))
a.dge <- estimateTagwiseDisp(DGEList(counts=a,group=c("B","A","A","B","A","B")))
a.dge.com <- exactTest(a.dge)
     detags <- function (COMPARISON, ADJUST="fdr", P=0.05, SORTBY="PValue", DIRECTION="all") {
       if (DIRECTION == "all") {
         significant <- ! decideTestsDGE(COMPARISON, adjust.method=ADJUST, p.value=P) == 0
       }
       if (DIRECTION == "up") {
         significant <- decideTestsDGE(COMPARISON, adjust.method=ADJUST, p.value=P) > 0
       }
       if (DIRECTION == "down") {
         significant <- decideTestsDGE(COMPARISON, adjust.method=ADJUST, p.value=P) < 0
       }
       significant <- COMPARISON$table[significant,]
       significant <- significant[order(significant[,SORTBY]),]
       rownames (significant)
     }
plotSmear(a.dge.dedup, allCol="grey", lowCol="grey", deCol="black", de.tags=detags(a.dge.com))


